图1表示某哺乳动物的一个器官中一些处于分裂状态的细胞图像,图2表示相关过程中细胞核内的DNA含量变化曲线示意图,有关叙述中错误的是
图1表示某哺乳动物的一个器官中一些处于分裂状态的细胞图像,图2表示相关过程中细胞核内的DNA含量变化曲线示意图,有关叙述中错误的是
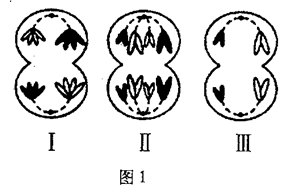
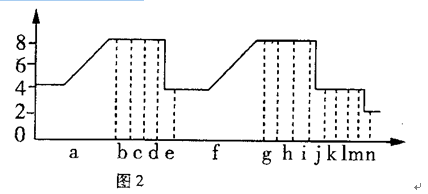
A.图1中Ⅰ、Ⅱ、Ⅲ细胞分别对应图2中的i、d、m区段
B.一个细胞经过图2曲线所示过程,最多可产生8个子细胞
C.图1和图2中,只有Ⅰ细胞和g、i对应的区段可能发生基因重组
D.图1中有4个染色体组的是Ⅱ和Ⅲ,图2中a、f对应的区段可能发生基因突变
正确答案:一个细胞经过图2曲线所示过程,最多可产生8个子细胞
A.图1中Ⅰ、Ⅱ、Ⅲ细胞分别对应图2中的i、d、m区段
B.一个细胞经过图2曲线所示过程,最多可产生8个子细胞
C.图1和图2中,只有Ⅰ细胞和g、i对应的区段可能发生基因重组
D.图1中有4个染色体组的是Ⅱ和Ⅲ,图2中a、f对应的区段可能发生基因突变
正确答案:一个细胞经过图2曲线所示过程,最多可产生8个子细胞
标签:动物生物学